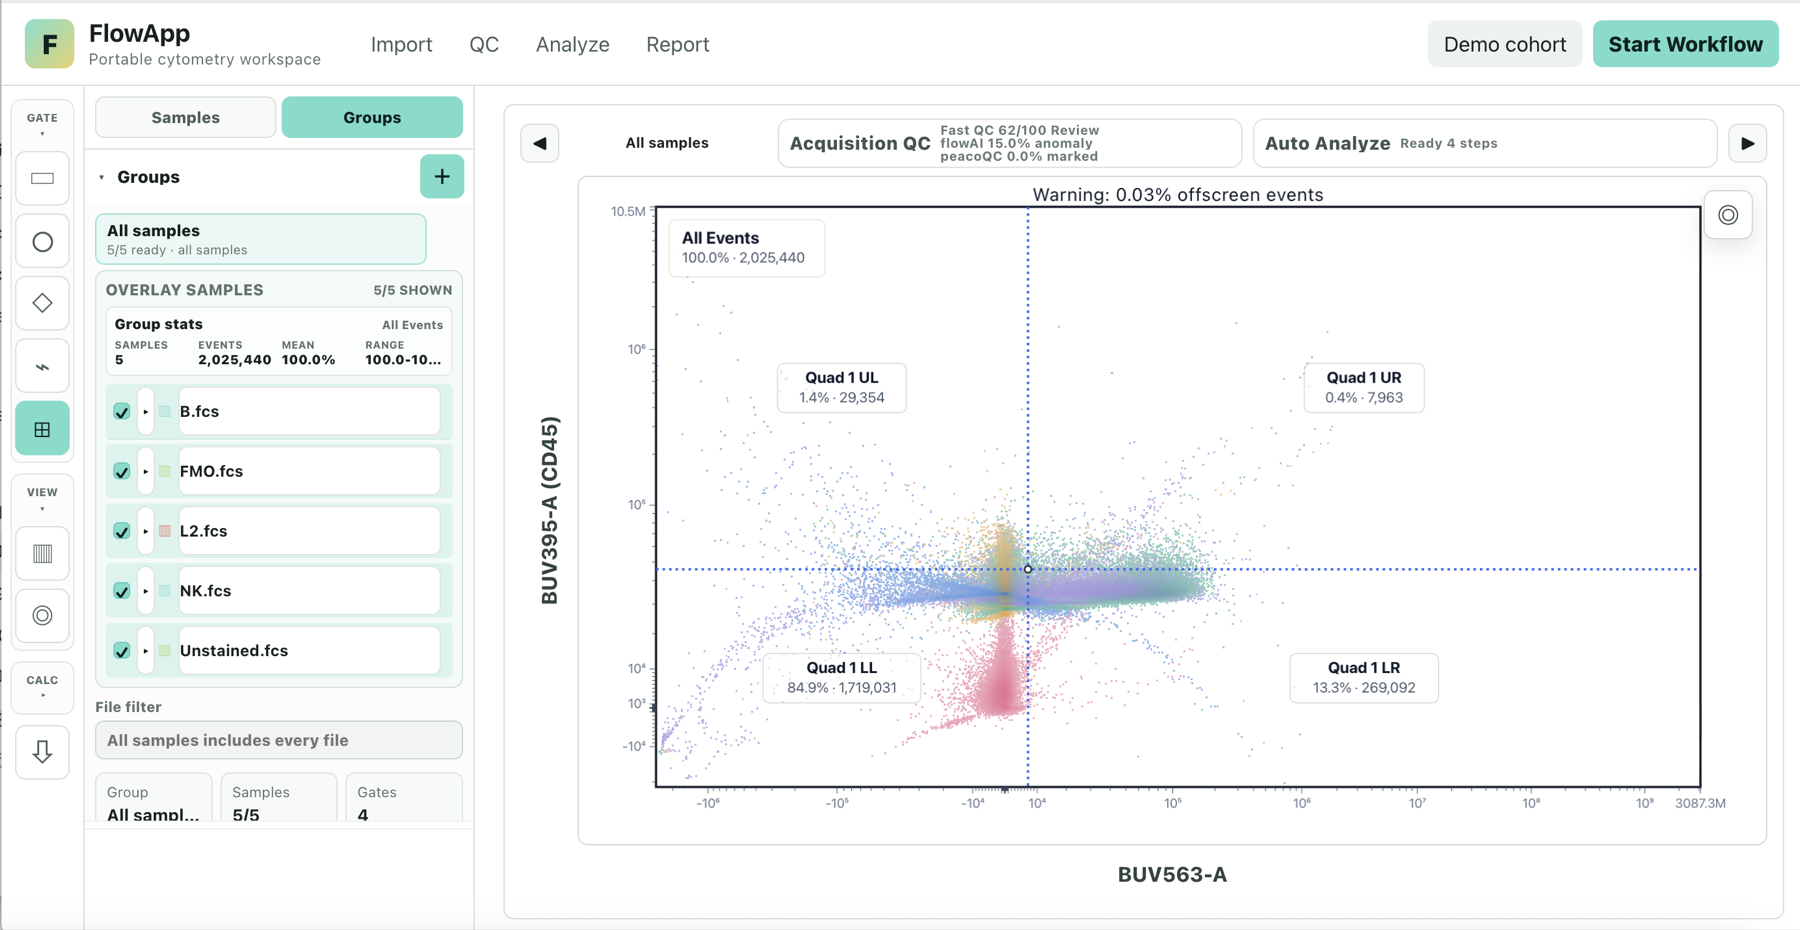
Can I open FCS files in a browser?
Yes. Open FlowApp and select local FCS files, or start with the synthetic demo dataset. Choose a sample, set the X/Y channels, inspect its event distribution and define gates. Large files depend on available browser memory and processing resources.
What happens to an embedded compensation matrix?
FlowApp reads supported SPILL/SPILLOVER information from the FCS file for file-based compensation. Check its status before gating. If no matrix is detected, the compensation workflow provides a separate control-data route; absence of a matrix does not prove that the events are uncompensated. Do not interpret automatic gate placement as a validated replacement for compensation controls.
How do metadata and groups relate?
Metadata describe samples; groups select samples using those fields. Manage embedded FCS fields, import external CSV metadata, or supplement editable fields using a filename extraction rule you define. Creating or editing metadata is separate from choosing group membership; FlowApp should not guess treatment or donor identity from a filename.
Which objects belong in each report?
A sample report contains the selected samples' results. A within-group report covers one selected group, with sample-level results and optional combined group plots. A cross-group report compares selected groups, with group summaries and optional individual sample results. A combined event plot is not a replacement for independent biological replicates in a statistical comparison.
Can I choose report figures and layouts?
Yes. Report Builder lets you select plot content, populations and available statistical chart types. You can include individual sample plots or combined group plots as appropriate to the scope, and choose the figure columns; the default is two figures per row. Review the layout in preview. The usefulness of a chart depends on the measurement and independent sample count, not the number of acquired events.
Can I work elsewhere while a report is generated?
Yes. Report rendering and optional AI interpretation continue when you close a dialog, switch samples or use other workspace controls. Completed reports, AI drafts and text edits are saved in Report history in the same browser, so reopening a saved report does not regenerate it. Unchanged inputs can reuse cached statistics, figures and AI drafts. Refreshing or closing the whole webpage interrupts unfinished client tasks. Clearing site storage removes local history; it is not a cloud backup or a cross-device sync service.
What does AI do in a report?
AI is optional. You can select an overall summary, data interpretation, both or neither before generation, and change those choices in preview. The configured model drafts explanations from report evidence; it does not replace the analysis modules' calculated statistics or researcher review. If the model request fails, the basic report remains available and you can retry. Review every interpretation against the gates, controls and study design.
What report data are sent to the model?
When you request report AI, report names, statistics, QC status and report text are sent to your configured model provider. The report evidence payload does not include raw event-level arrays. Your provider credentials are used to authenticate the request, but are not stored inside the saved report artifact. Identifying sample names and metadata may still be sensitive; review your provider settings and institutional policy before enabling AI.
Which export formats are available?
Preview the report, choose its language and export format, then set a filename. FlowApp supports HTML and PowerPoint (.pptx) export; PDF uses the browser print or save-as-PDF workflow. Figures, section navigation and text should be reviewed in preview and checked again in the exported file.
What does the public example demonstrate?
The public group report uses synthetic demonstration data to show report structure, figures and descriptive statistics. It is not a biological result or a validation of all analysis modules. The separate public-data cell-cycle case documents its dataset, comparison and limitations; inspect those limits rather than assuming all modes have equivalent validation.