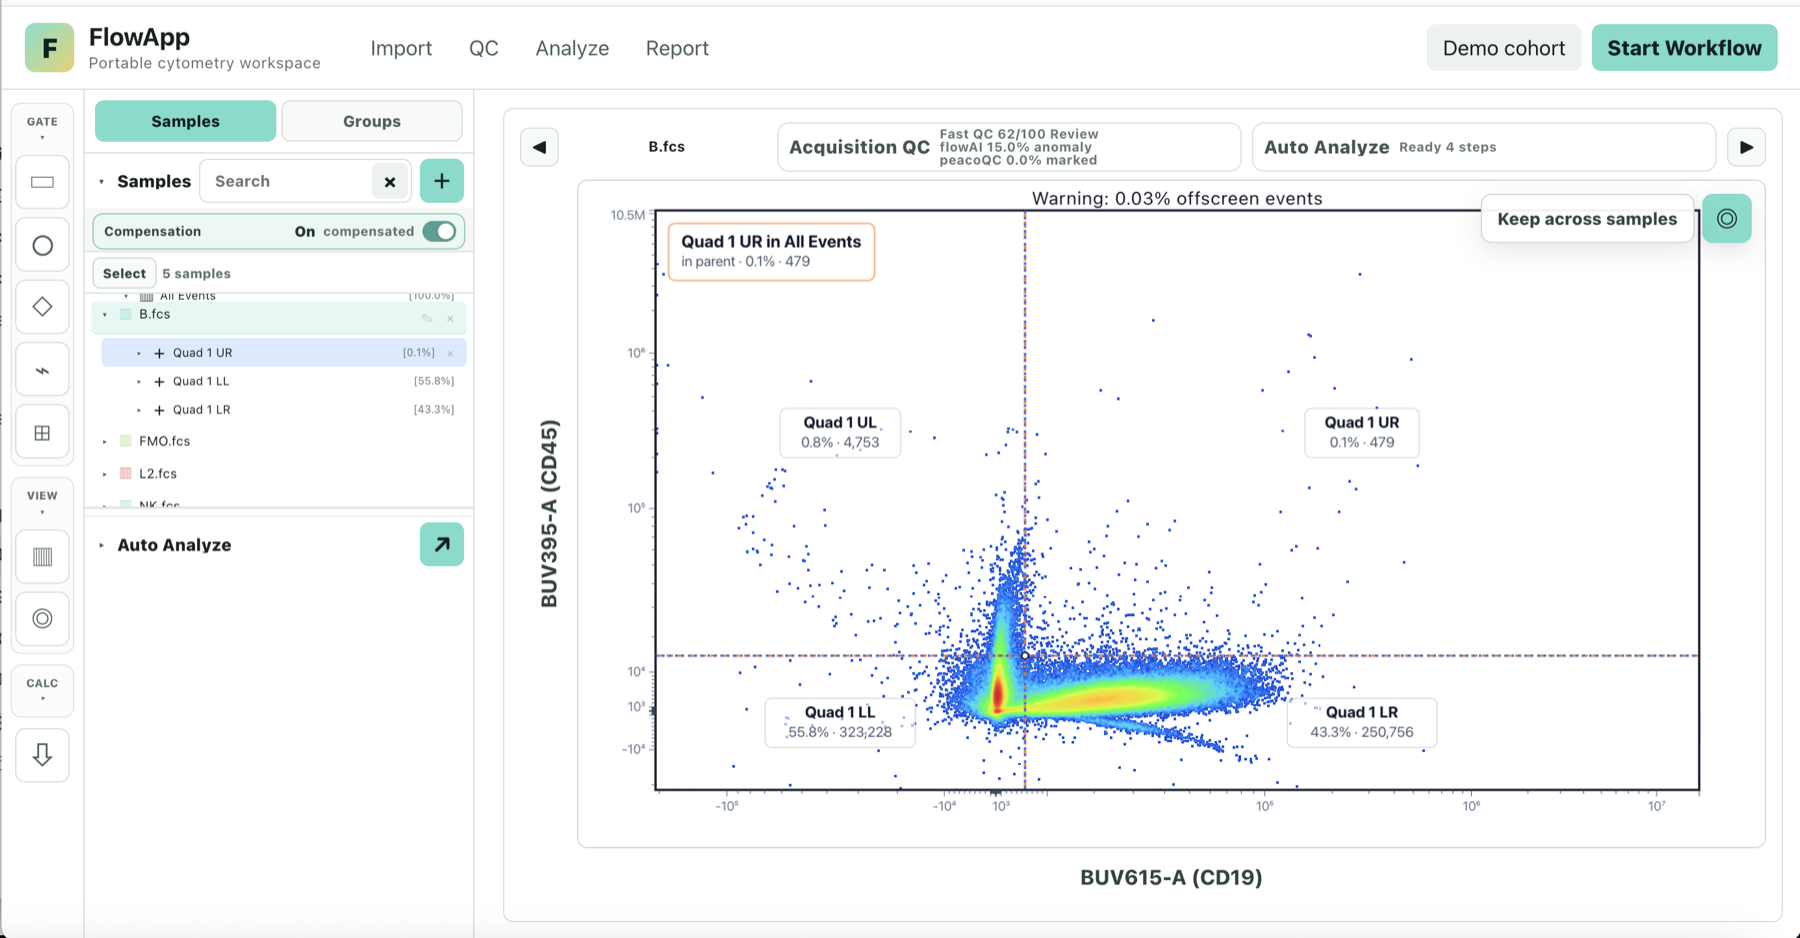
1. Open a sample
Open FlowApp with the demo dataset to explore without preparing files. To review your own data, choose the file import action and select one or more FCS files from your device.
2. Confirm the sample and channels
Select a sample and inspect its event count and available parameters. Set the plot axes to the scatter or fluorescence channels relevant to the population you want to examine. Channel names and detector labels come from the file and can vary between instruments and panels.
3. Review compensation and display
Check whether compensation information is available and whether the current view indicates compensated data. Confirm that the axis scale is suitable for the signal range; compensated values can include negative events, so a zero-clipped display can hide relevant structure.
For background, see how to check compensation matrices.
4. Gate with the experimental question in mind
Use plots to define populations in a gating tree. Review each gate against the parent population and relevant channels. A gate is an analysis decision: verify it on the sample and use appropriate controls and domain knowledge before interpreting the resulting percentages.
5. Organize samples and review results
Group related samples using the experiment's metadata, then compare overlays and descriptive summaries. Before exporting, check the selected samples, gate hierarchy, statistic denominator, and report language.
Common issues
- If a file fails to open, confirm it is an FCS file and try importing it again.
- If a channel label is unexpected, inspect the parameter names and metadata in the source file.
- If the plot appears empty, check the selected axes, scale, and active gate.
- Large datasets may take longer to parse and render in the browser.
These steps describe a review workflow, not a substitute for instrument QC or experimental controls. Read FlowApp help or contact the team.